

This article builds on the ideas introduced in Part 1: The Poultry Industry’s Biggest Competitor Isn’t Another Chicken Producer.
In my previous article, I argued that the poultry industry’s biggest competitor isn’t necessarily another chicken producer. Sometimes, it is simply an ingredient that occupies more space on the consumer’s plate than chicken itself.
That article introduced the concept of Chicken Share of the Plate.
This raises a bigger question.
If the poultry industry wants to understand future demand, are today’s metrics enough?
Most reports focus on total chicken production, per-capita consumption, or year-on-year growth. These are valuable, but they don’t explain why demand changes or how consumers are actually eating chicken.
I believe the industry needs a richer dashboard.
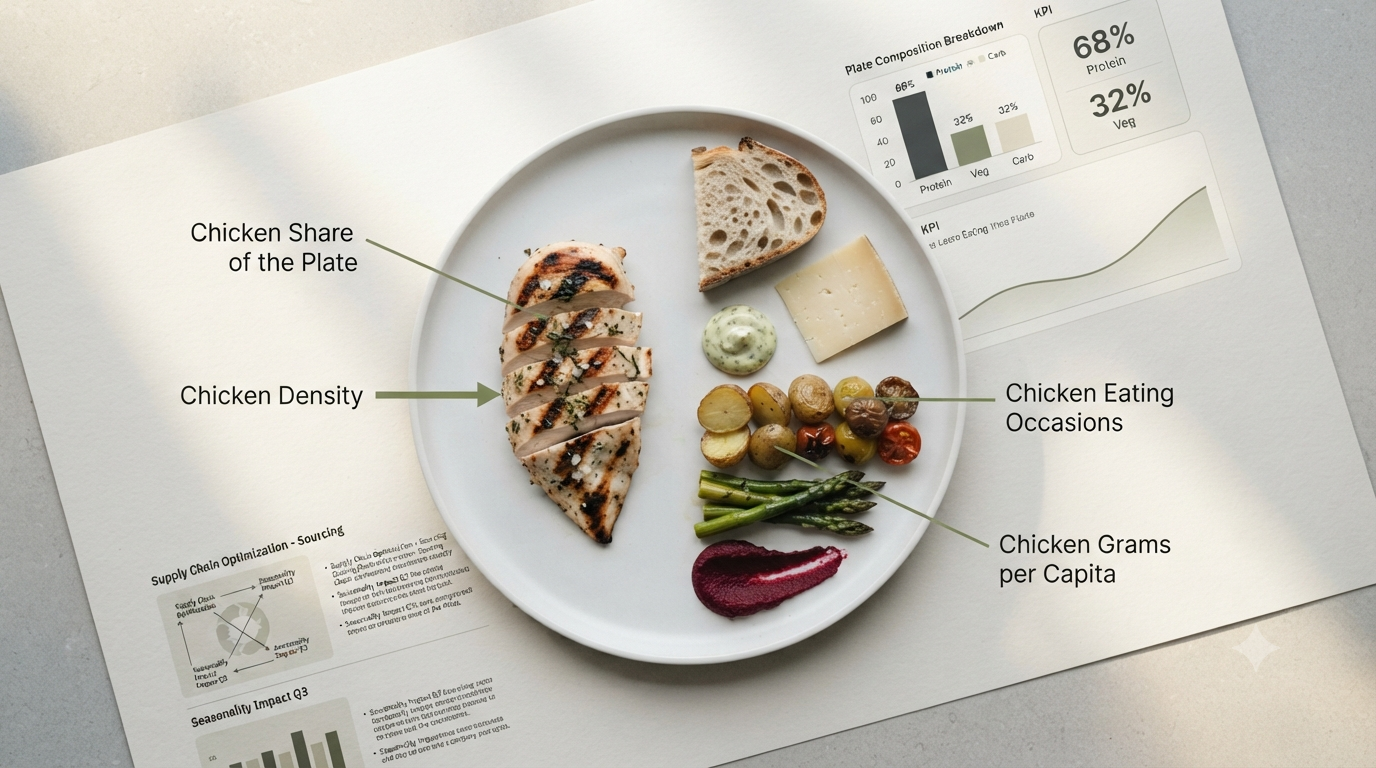
1. Chicken Eating Occasions (CEO)
This measures how often consumers choose chicken.
Breakfast, lunch, dinner, snacks, home delivery, restaurants, ready-to-eat products—>every occasion matters.
Increasing eating occasions has been one of the poultry industry’s greatest success stories over the last two decades.
But frequency alone doesn’t tell the complete story.
2. Average Chicken Density (ACD)
Not every chicken meal contains the same amount of chicken.
A grilled chicken breast has a high chicken density.
A chicken pizza or sandwich may have a much lower density because bread, cheese, vegetables, sauces, and other ingredients occupy a larger share of the product.
Tracking Average Chicken Density helps answer an important question:
Are consumers eating chicken more often or simply eating products that contain a little chicken?
3. Chicken Share of the Plate (CSP)
Perhaps the most important metric of all.
Imagine looking at every plate served in restaurants and homes.
How much of that plate is actually chicken?
Chicken Share of the Plate captures this idea.
Two meals may both be classified as chicken dishes, yet one may devote 70% of the plate to chicken while another only 20%.
For poultry producers, that difference matters enormously.
4. Chicken Grams Per Capita (CGPC)
Per-capita chicken consumption is already widely tracked.
But converting that into average grams consumed per person per day, week, or meal provides a far more operational view of demand.
This metric links consumer behaviour directly with production planning, feed demand, processing capacity, and long-term investment decisions.
5. Restaurant Menu Density (RMD)
Restaurants influence food habits more than we often realise.
Not just by deciding whether chicken appears on the menu —> but by deciding how much chicken appears in each dish.
Imagine comparing two restaurant chains.
Both offer ten chicken dishes.
One serves generous portions centred around chicken.
The other relies on cheese, bread, sauces, and toppings, using chicken primarily as an ingredient.
Traditional menu analysis says both have equal chicken representation.
Restaurant Menu Density tells a different story.
6. Processed Food Dilution Index (PFDI)
This is perhaps the boldest metric.
As processed foods evolve, manufacturers continuously balance cost, taste, convenience, and nutrition.
One consequence is that chicken may gradually become a smaller proportion of finished products.
The Processed Food Dilution Index attempts to measure this trend.
It asks a simple question:
Is chicken becoming the hero of the product—or merely one ingredient among many?
This is not a criticism of processed food.
Processed products have dramatically expanded the poultry market.
The objective is simply to understand whether future growth comes from more chicken or more products carrying the word “chicken.”
Looking Beyond Tonnes Produced
For decades, the poultry industry has measured success by production volumes.
Tomorrow’s winners may also measure consumer behaviour with equal precision.
- How often do people eat chicken?
- How much chicken do they eat each time?
- How much of the plate belongs to chicken?
- How much chicken is present in processed foods?
These questions may sound academic today.
I believe they could become strategic tomorrow.
After all, industries evolve not only by producing better products —> but also by measuring the right things.
Perhaps it’s time for the poultry industry to move beyond chicken consumption and begin measuring chicken presence.
Disclaimer
The metrics proposed in this article are not industry standards, nor are they intended to replace existing measures. They are simply a thought experiment designed to stimulate discussion on how the poultry industry might better understand changing consumer behaviour.
If these ideas encourage new conversations or inspire better metrics—> I would consider this article a success.
A Note to Readers From the Poultry Industry
The poultry industry already tracks numerous operational and market indicators. The ideas presented here are not meant to suggest those are inadequate, but to explore whether consumer-centric metrics could complement them in an evolving food ecosystem.
Consider these concepts as conversation starters rather than conclusions.
This article is part of the Rethinking Poultry Demand series.
If you haven’t already, you may find these related articles useful:
- Part 1: The Poultry Industry’s Biggest Competitor Isn’t Another Chicken Producer
- Part 3: What Really Drives Chicken Demand? A Consumer Behaviour Framework
- Part 4: Why the Poultry Industry Should Think Like a Consumer Goods Company
- Part 5: You Don’t Need More Metrics. You Need a Consumer Intelligence System
I’d love to hear your thoughts. Which consumer or demand metrics do you believe will shape the poultry industry over the next decade?
